Article Note: This article “12 Best Tools to Create your Own Well-Designed Infographics” was first published on 29th April 2016. We last updated this article on 21st September 2022 with fresh information.
If you want to start creating your own infographics, you might be wondering what the best tools available for this task are. As people are becoming more and more interested in visual resources, and tending to share this kind of content more often is understandable that you are looking for the top options here.
And yet, infographics can take a lot of work, if you don’t know how to create them, or if you try to do it by using traditional tools, such as Microsoft Excel, Adobe Illustrator, or Corel Draw. So, without making you wait any other second, let’s tell you about the 12 best tools available to help you to create your own well-designed infographics.
1. Canva (Free)

Full of templates and easy to use, Canva is one of the most popular tools for infographics creation, as it the home to over 9 million users so far. They also offer a large number of fonts, icons, and images (photos, vectors, illustrations), and everything is very well-organized, so you can get the job done in no time. There are also photo filters available, and you can upload your own images if you prefer.
Recommended for you: 15 Great Ways to Start Your Career in Freelance Graphic Design.
2. Infogr.am (Free, pay for extra features)
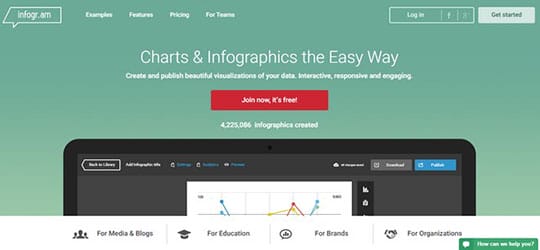
If you need something more focused on data and charts, you should have a look at Infogr.am. This tool allows you to create charts in a very professional manner. Your visualization won’t be just nice to look at but also interactive and responsive, as this tool leaves your infographics ready for mobiles and tablets. They also have templates to get you started and allow you to add maps, videos, and more.
3. VistaCreate (Free)
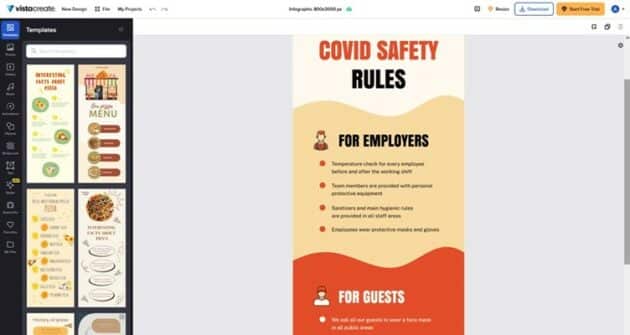
Even if you are going to build an infographic for the first time, VistaCreate is an ideal tool for creating a professional and visually perfect one. Using dozens of pre-made designs exclusively for infographics, you can start really quickly, after that customizing your design with the help of the fonts library, color palette, numerous photos, videos, and vectors. It’s worth saying that you can do that via a web-based platform as well as from your phone or tablet since VistaCreate provides iOS and Android apps. When done, you can either save your infographic in various formats or publish it directly on social media.
4. Google Chart Tools (Free)
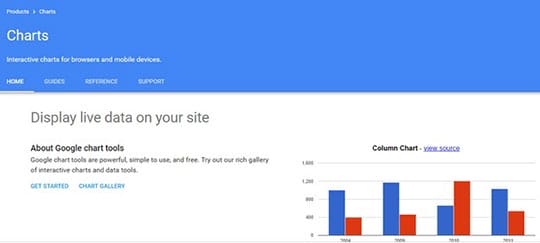
If all that you need is a great chart tool, Google has one for you. Google Chart Tools has a rich gallery of charts, so you can find the best one for your need, and it leaves many customization options available for you. You can connect your data in real-time, and it comes with cross-browser compatibility and cross-platform portability to iOS and new Android releases without requiring any plugin.
5. Visually (Paid per project)

Let’s say that you don’t have the time or the expertise to create your own infographics. So then Visually is all you have been looking for. With this tool, you can be in touch with over 1000 hand-picked freelance designers, writers, and developers, get a quote with them and create an infographic that will stand out. Or, if you are just looking for ideas, you certainly should check their excellent portfolio.
6. Venngage (Free, pay for extra features)
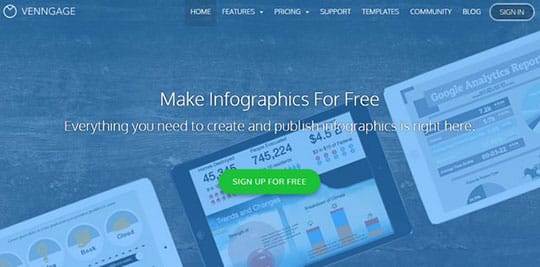
Venngage promises that you will get your infographics ready after only 3 steps. All that you have to do is to choose a template, add charts and visuals, customize your design, and your infographic will be ready to be published, shared, or downloaded. Still, they offer an advanced design tool for those looking for a bit more control over their creation.
7. Piktochart (Free, pay for extra features)
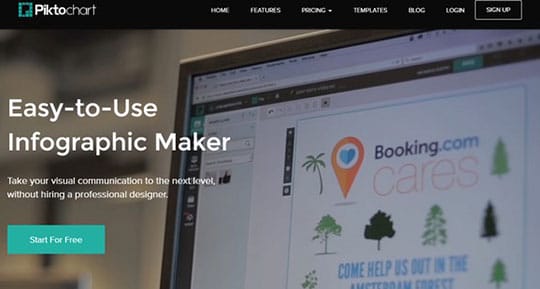
Piktochart is proud of its weekly updated library with over 500 templates created by professional designers. And, after you pick your favorite, you will be able to add charts, maps, icons, photos, or videos. You can also import data directly from Google Spreadsheets and Survey Monkey. Then you can share your creation using a simple link or an HTML code (so then you can add it to your website). It is also possible to instantly present it in slideshow format, or download it in several formats and resolutions.
You may like: 13 Best Graphic Design Software for Windows (Free and Paid).
8. Visme (Free, pay for extra features)

Promising to transform boring content into something beautiful and easy to understand, Visme has features ready to engage your readers. It is also a responsive tool that will allow you to create a piece once and present it on your computer, mobile, or tablet. It gives you a privacy control tool so that you can make your content public, private, or password protected, and accesses your infographics from anywhere you are. Other options include adding video, controlling playback, and uploading audio or recording voice-over right inside the editor.
9. Creately (Free public diagrams, pay for privacy and extra features)
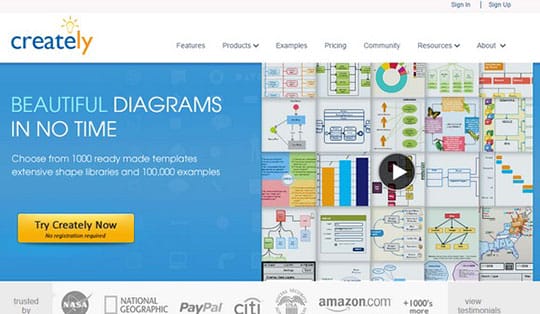
But if all that you need is to create diagrams in a collaborative way, it is time for you to check Creately. With this tool, you will have access to over 50 diagrams, features to help you to get the work done faster, plus thousands of examples and shapes libraries. Creately is ready for real-time collaboration and comes with plugins for Confluence, JIRA, and FogBuzz. It is also integrated with Google Apps and Chrome Store, and you can use it online and offline.
10. Tableau Public (Free)
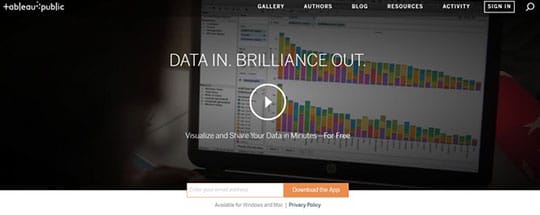
If you want to have a taste of the super powerful tool called Tableau Software, you can start with their free version, Tableau Public. This is a desktop solution available for Android and Mac, and you can easily create professional-looking infographics with it using their Drag & Drop tools. You will also get 1GB of storage space, so you can store your creations and share them with the world – just have in mind that this is a public library, so everybody will have access to your infographic.
11. Easel.ly (Free)
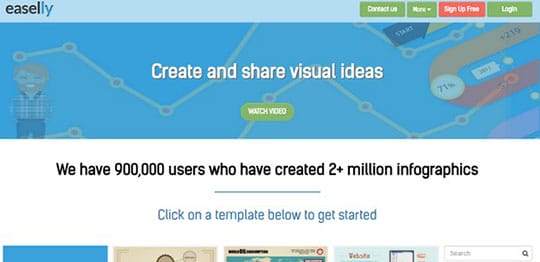
With clients such as U.S. government agencies and Boeing, Easel.ly is an easy-to-use tool that will make you feel that you can create any infographics. You can get started by using one of their over 1,000 templates or you can opt for a blank page and add any of the elements included to their libraries: fonts, icons, images, etc. Their dashboard is very intuitive, and you will find your way around very easily.
12. ChartsBin (Free)
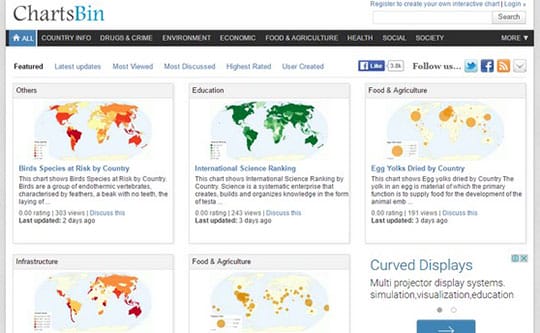
Here you will find a huge map and chart database to get some inspiration for your own infographics. But that’s not all. ChartsBin also offers a very intuitive tool (and a video tutorial is also available), the VizBuilder, and several maps, to help you to create your own interactive chart. And when you get it done, you can just copy and paste the HTML code, so you can publish it on your website or blog.
You may also like: 9 Important Tools for Graphic Designers You Must Know About in 2022.
Conclusion

If you want to create well-designed infographics, you have plenty of options of tools at your disposal. From those with only basic features to others at a professional level, you will find something that will meet your expectations very easily.
So, start creating your infographics right now, and enjoy the benefits that they will bring to the traffic to your website, blog, or social media post.
This article is written by Diana Beyer. She is an experienced and self-driven media expert who is passionate about writing. Her purpose is to share values with those interested. She is always seeking to discover new ways for personal and professional growth. Follow her: Blog | Facebook | Twitter | Google+ | Linkedin.


